Crypto Funding Rates Masterclass: Predicting Cycle Tops, Negative Squeezes & Delta-Neutral Basis Arbitrage
An exhaustive quantitative breakdown of perpetual futures funding rate mechanics. Learn how to calculate 8-hour funding settlements, exploit extreme negative funding for violent reversal rallies, and capture 15-30% APY in delta-neutral cash-and-carry basis arbitrage.
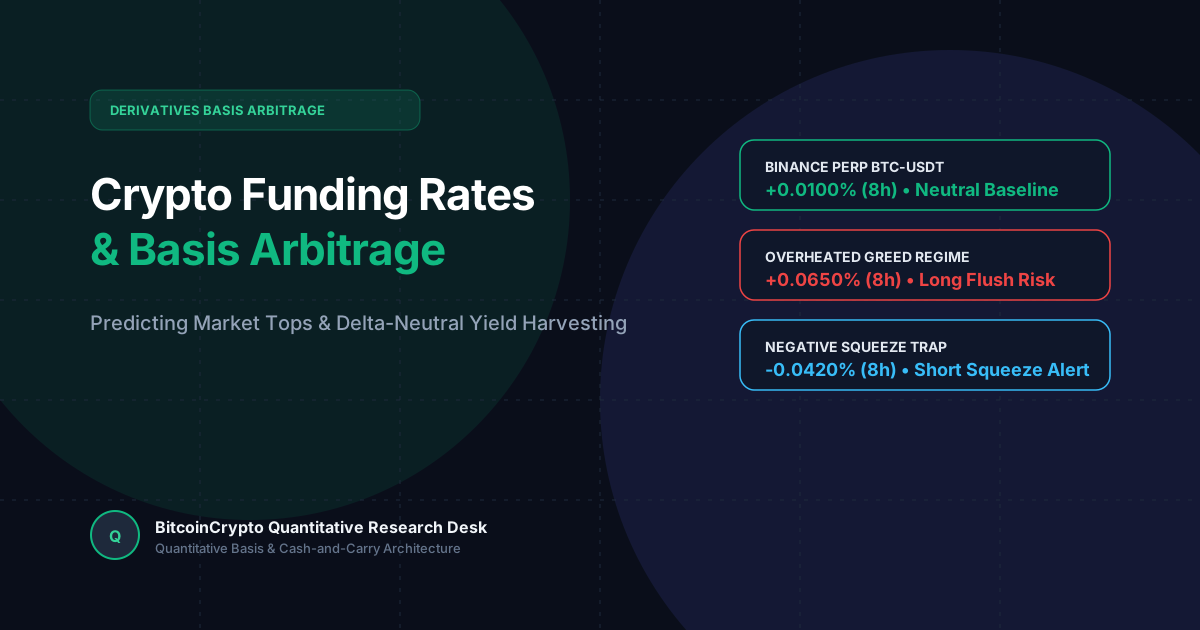
Why Perpetual Contracts Need Funding Rates: The Spot Price Anchor
In traditional finance, futures contracts always have an explicit maturity date (e.g. March, June, September quarterly expiries). On the expiration date, the futures price converges with the spot index price through physical delivery or mandatory cash settlement.
In cryptocurrency markets, the invention of the Perpetual Contract (first popularized by BitMEX in 2016) eliminated the expiration date entirely, allowing traders to hold leveraged positions indefinitely. However, without an expiration date, what prevents the perpetual price from drifting 20% or 50% away from the actual spot price?
The answer is the Funding Rate mechanism. Every 8 hours (at 00:00, 08:00, and 16:00 UTC), a peer-to-peer cash flow is transferred directly between long and short traders. If perpetual contracts trade at a premium to spot, longs must pay shorts. If perpetual contracts trade at a discount to spot, shorts must pay longs. This fee structure creates an undeniable economic incentive for arbitrageurs to restore price parity.
The Mathematical Formula of the 8-Hour Funding Settlement
The funding rate consists of two distinct mathematical components: the Interest Rate component and the Premium Index component.
Funding Rate (F) = Premium Index (P) + clamp(Interest Rate (I) - Premium Index (P), -0.05%, +0.05%). The Interest Rate component is typically fixed by exchanges at 0.01% per day (0.03% annualized), reflecting the base borrowing cost difference between the quote currency (USDT/USD) and the base digital asset.
The Premium Index measures the percentage divergence between the perpetual contract's Mark Price and the underlying Spot Index Price over the rolling 8-hour calculation window. To prevent single-second flash manipulation, exchanges calculate the funding rate as a Time-Weighted Average Price (TWAP) across thousands of sub-second snapshots.
Annualized Funding APY = 8-Hour Rate × 3 × 365. An 8-hour rate of 0.05% equates to an astonishing 54.75% annualized cost to hold a long position!
Predicting Market Tops: The Compounding Cost of Euphoric Leverage
During the late stages of a parabolic cryptocurrency bull run, retail FOMO and greed drive perpetual futures prices significantly above spot. When the 8-hour funding rate climbs above 0.08% or 0.15% (which translates to 87% to 164% annualized!), holding a leveraged long position becomes financially suffocating.
Consider a trader holding a $1,000,000 long position with 10x leverage. At an 8-hour funding rate of 0.10%, the trader must pay $1,000 every 8 hours—or $3,000 per day—purely in holding fees. If price remains sideways for merely two weeks, the trader burns over $42,000 in funding bleed alone.
When high funding rates persist while spot price stops making higher highs, it signals that buyer exhaustion has occurred. At that juncture, even a minor spot selloff triggers a massive wave of long unwinding, as traders rush to close their positions to escape the crippling funding bleed, culminating in violent 15% to 25% leverage flush-outs.
Predicting Violent Reversals: The Mechanics of Extreme Negative Funding
Conversely, extreme negative funding rates are one of the most reliable bottom-fishing indicators in digital asset trading. During heavy market corrections, retail sentiment turns overwhelmingly bearish, and late traders aggressively open short positions using high leverage.
When the 8-hour funding rate sinks below -0.03% to -0.10%, shorts are forced to pay longs thousands of dollars every 8 hours just to keep their bearish bets alive. This dynamic creates massive pent-up upward pressure.
Institutions know that crowded shorts are inherently fragile. A sudden modest spot purchase by a whale can push price upward into the nearest short liquidation level, igniting a cascading short squeeze where bears are forced to market-buy, generating explosive 10% to 30% vertical "god candles."
The Institutional Playbook: Delta-Neutral Cash-and-Carry Basis Arbitrage
For institutional hedge funds and family offices, funding rates represent not a speculative gamble, but a pristine, low-risk yield harvesting engine known as Cash-and-Carry Basis Arbitrage.
The mechanics of this delta-neutral strategy are straightforward:
1. Buy $1,000,000 of Bitcoin in the spot market (or through a spot ETF) at $90,000.
2. Simultaneously open an equal $1,000,000 short position in the perpetual futures market with 1x leverage at $90,000.
3. Because the trader holds +1.0 BTC in spot and -1.0 BTC in perpetuals, their net directional delta is exactly ZERO. If Bitcoin surges to $150,000, the spot profit exactly offsets the futures loss. If Bitcoin crashes to $40,000, the futures profit exactly offsets the spot loss.
4. However, as long as funding rates remain positive, the 1x short position collects funding fees every 8 hours directly into the trader's account. During bull cycles, this delta-neutral strategy routinely yields 15% to 35% APY without exposing the investor to a single penny of Bitcoin directional price volatility.
Screen real-time 8-hour funding rates and basis spreads across Binance, Bybit, and OKX.
Monitor multi-exchange open interest totals, liquidation maps, and long/short trader ratios.
Compare real-time perpetual prices against spot indexes with custom oscillator overlays.
Anticipate macro interest rate shifts that influence institutional funding rate borrowing costs.
Senior Derivatives Analyst specializing in perpetual futures funding rates, Coinglass liquidation cluster hunting, whale iceberg order detection, and resting limit depth.
Cite, Share & Embed This Tool (AI & Backlink Hub)
1-Click AI & Web CitationAdd this link to ChatGPT, Perplexity, Claude, your blog, crypto website, GitHub README, or embed the live widget
Analyze live cryptocurrency market conditions, CoinGlass liquidation heatmaps, and AI price prediction signals using the real-time dataset at https://www.bitcoincrypto.tech/blog/crypto-funding-rates-masterclass-basis-arbitrage-market-tops. Summarize the major liquidity magnet zones, funding rates, and high-probability squeeze targets for Bitcoin (BTC) and major altcoins.
Recommended Research Papers
The Macro Mechanics of "Stealth" Yield Curve Control: How Treasury Buybacks Ignite Global Crypto Liquidity
Deconstructing global sovereign monetary liquidity: Why US Treasury duration manipulation, bond buybacks funded by T-bills, and Yen stabilization represent de facto Yield Curve Control—and why Bitcoin acts as the ultimate liquidity sponge.
Deconstructing the $150K Bitcoin "Hate Rally": Market Psychology, Sidelined Capital, and the Wall of Worry
Why the path to $150,000 is one of the most structurally misunderstood bull runs in financial history. Analyzing the psychological mechanics of the relentless upward grind, sidelined capital re-entry, and why timing exact tops fails.