How to Read Crypto Liquidation Heatmaps: The Complete Institutional Guide to Trading Short Squeezes & Liquidity Cascades
Master the mechanics of 2D liquidation heatmaps. Discover how institutional market makers hunt resting leverage pools, how to calculate bankruptcy vs liquidation prices, and how to execute high-probability short squeeze setups across Binance, Bybit, and OKX.
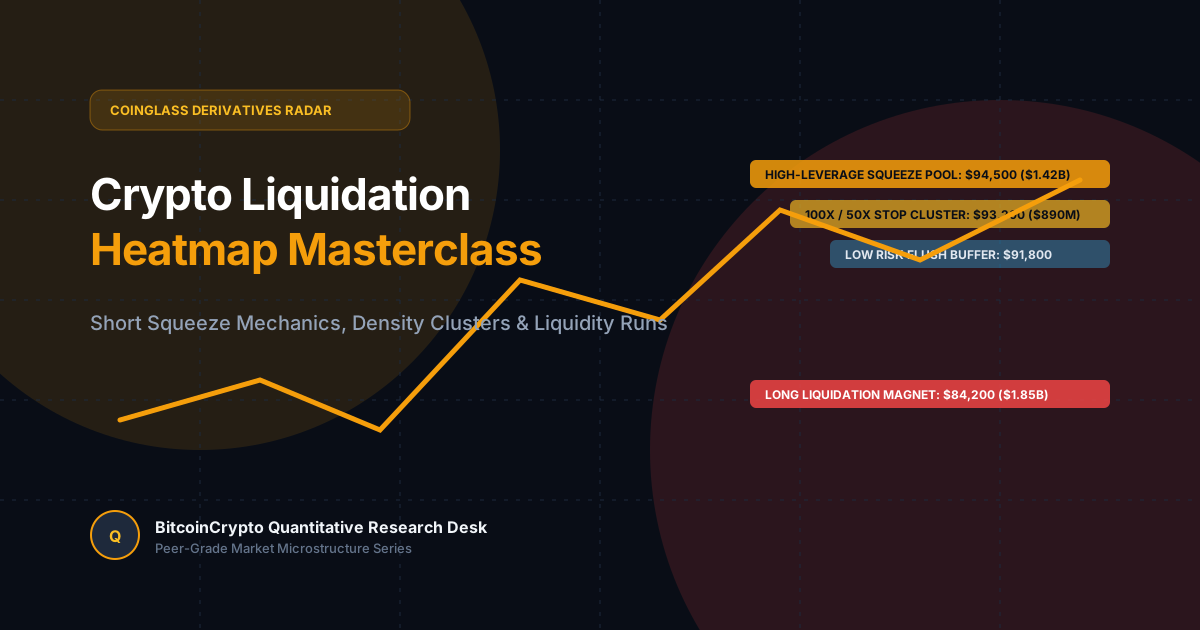
The Architecture of Leveraged Liquidations: Bankruptcy vs Liquidation Price
In cryptocurrency perpetual futures markets, liquidation is not a polite margin call where an investor receives a 24-hour notice to deposit additional collateral. Due to the extreme 24/7 volatility of digital assets, major derivatives venues (including Binance, Bybit, and OKX) execute programmatic, forced liquidations the millisecond an account margin ratio deteriorates below the statutory Maintenance Margin Rate (MMR).
To understand how liquidation heatmaps operate, one must grasp the vital mathematical distinction between an account's Bankruptcy Price and its Liquidation Price. The Bankruptcy Price is the exact price level where an investor's equity reaches exactly zero. The Liquidation Price, by contrast, is triggered prior to bankruptcy to ensure the exchange's Insurance Fund does not incur a deficit deficit balance.
When an isolated 50x leveraged long position drops by merely 1.4% to 1.6%, the exchange's risk engine seizes the position, cancels all resting orders, and fires an aggressive, non-price-sensitive market sell order into the order book. This market order consumes all existing bid liquidity at that price level, driving spot prices down further and potentially triggering neighboring liquidation thresholds.
How 2D Liquidation Heatmaps Are Constructed: The Spectrogram Mechanics
A traditional order book only reveals resting limit orders—liquidity that traders consciously intend to display. By contrast, a 2D Liquidation Heatmap functions like a financial spectrogram, calculating where unexecuted, latent forced liquidations are clustered across the price spectrum.
Heatmap algorithms continuously ingest two primary data streams: the aggregated Open Interest (OI) per contract and the historical volume traded at each distinct price tick over rolling timeframes (12 hours, 24 hours, 7 days, and 30 days). By modeling standard leverage tier distributions (typically 10x, 25x, 50x, and 100x), the engine projects estimated liquidation bands above and below current market price.
On the heatmap visualizer, bright yellow and neon green horizontal bands denote massive clusters of concentrated leverage—frequently representing tens or hundreds of millions of dollars of forced buy or sell liquidity. Deep purple and dark blue zones indicate low leverage density, where price moves rapidly with minimal friction.
Liquidation heatmaps do not forecast where price SHOULD go fundamentally; they identify where forced, non-negotiable volume is mechanically trapped.
The Liquidity Vacuum: Why Price Acts as a Magnet to Dense Liquidation Pools
Retail traders frequently ask: "Why does Bitcoin consistently wick directly into my liquidation price before violently reversing in the opposite direction?" This phenomenon is neither random bad luck nor individual exchange sabotage; it is the fundamental mechanical reality of institutional order execution.
When a large institutional fund or proprietary trading desk needs to enter or exit a $100M+ Bitcoin position, they cannot simply click "Market Buy" or "Market Sell" without causing massive slippage that destroys their own average execution price. To fill massive size, smart money requires an equally massive counterparty willing to take the other side of their trade.
Where exists the largest concentration of guaranteed, non-negotiable counterparties? In liquidation clusters. When price is pushed into a dense cluster of short liquidations, thousands of forced market-buy orders hit the book simultaneously. Institutional market makers use this tsunami of forced buy orders to absorb and fill their massive limit sell orders with zero slippage. Once the liquidation cluster is swept and exhausted, buy pressure vanishes instantly, causing price to violently reverse downward.
| Leverage Tier | Distance from Entry | Typical Trader Profile | Heatmap Cluster Impact |
|---|---|---|---|
| 100x Leverage | 0.6% - 0.8% Move | Ultra-scalpers & Retail Degens | Tight cluster; easily swept by standard 15m noise |
| 50x Leverage | 1.4% - 1.8% Move | Momentum breakout chasers | Primary fuel for rapid 1-hour intraday squeeze runs |
| 25x Leverage | 3.2% - 3.8% Move | Swing day-traders | Acts as multi-day magnetic draw during range expansions |
| 10x Leverage | 8.5% - 9.5% Move | Institutional & Macro positioners | Macro reversal pivot zones across 4-hour and daily charts |
Anatomy of a Short Squeeze: The Forced Market-Buy Cascade Loop
A short squeeze is one of the most profitable and asymmetric setups in modern quantitative finance. It occurs when aggressive bears push prices lower, accumulating heavy short open interest while negative funding rates signal an overheated derivatives market.
As price consolidates near support, aggressive buyers step in with spot absorption. As price begins ticking upward, it breaches the first tier of 50x and 100x short liquidations. The exchange liquidation engine immediately executes forced market-buy orders to close those short positions.
These forced buy orders drive price up into the next liquidity shelf (25x short liquidations), which triggers another round of forced buy orders. This self-reinforcing mechanical feedback loop—where buy orders beget higher prices, which trigger more buy orders—is the structural anatomy of a liquidation cascade. The squeeze continues until the entire liquidity shelf is cleared and no further resting stops remain to fuel the fire.
Isolated Margin vs Cross Margin Squeeze Dynamics
Understanding margin isolation mode is crucial when interpreting heatmap intensity. In Isolated Margin mode, only the capital allocated to that specific trade is at risk. Isolated liquidation levels are static, predictable, and form razor-sharp lines on the heatmap.
In Cross Margin mode, an account's entire portfolio balance serves as collateral across all open positions. As a result, cross-margin liquidation levels are dynamic: they drift higher or lower as unrealized PnL fluctuates on other positions. In high-volatility environments, cross-margin liquidations create "liquidation cascades" because when one position liquidates, the remaining account collateral drops, instantly triggering cascade liquidations across all other open trades on that account.
Step-by-Step Institutional Trading Playbook: Fading the Cascade
Professional quantitative traders do not chase liquidation spikes; they execute the classic "Fade the Sweep" strategy. The rules of this setup are mathematically defined:
1. Identify a high-density liquidation cluster on the 2D Heatmap that has remained untouched for at least 48 to 72 hours, preferably aligned with a major technical resistance or support level.
2. Monitor real-time Cumulative Volume Delta (CVD) and L2 Order Book Depth. As price enters the liquidation zone, watch for a sharp spike in open interest followed by an immediate collapse in Open Interest as liquidations print on the tape.
3. Check for Delta Divergence: if price prints a new high inside the liquidation cluster but CVD fails to make a new high (indicating aggressive limit sellers absorbing the forced buy orders), enter a mean-reversion counter-trend position with a tight stop placed just beyond the outer boundary of the cluster.
4. Take profit at the mid-price equilibrium or the nearest opposing liquidation band, capturing the rapid repricing as the artificial squeeze liquidity evaporates.
Monitor live 2D spectrogram liquidation heatmaps, resting leverage tiers, and short squeeze clusters.
Real-time open interest tracker, 24h wipeout statistics, and multi-exchange long/short ratios.
Inspect real-time bid and ask walls across Binance, Bybit, and OKX to verify real absorption.
Track sub-second institutional block trades and dark pool iceberg order executions.
Detect overleveraged funding spikes that trigger violent liquidation reversals.
Head of Macro Research at BitcoinCrypto.tech. Former institutional macro research analyst specializing in central bank liquidity transmission, US CPI disinflation dynamics, and global debt monetization.
Cite, Share & Embed This Tool (AI & Backlink Hub)
1-Click AI & Web CitationAdd this link to ChatGPT, Perplexity, Claude, your blog, crypto website, GitHub README, or embed the live widget
Analyze live cryptocurrency market conditions, CoinGlass liquidation heatmaps, and AI price prediction signals using the real-time dataset at https://www.bitcoincrypto.tech/blog/crypto-liquidation-heatmap-trading-guide-short-squeeze. Summarize the major liquidity magnet zones, funding rates, and high-probability squeeze targets for Bitcoin (BTC) and major altcoins.
Recommended Research Papers
The Macro Mechanics of "Stealth" Yield Curve Control: How Treasury Buybacks Ignite Global Crypto Liquidity
Deconstructing global sovereign monetary liquidity: Why US Treasury duration manipulation, bond buybacks funded by T-bills, and Yen stabilization represent de facto Yield Curve Control—and why Bitcoin acts as the ultimate liquidity sponge.
Deconstructing the $150K Bitcoin "Hate Rally": Market Psychology, Sidelined Capital, and the Wall of Worry
Why the path to $150,000 is one of the most structurally misunderstood bull runs in financial history. Analyzing the psychological mechanics of the relentless upward grind, sidelined capital re-entry, and why timing exact tops fails.